Fares, Not Just Flats: Redrawing London’s Affordable Neighbourhoods in 2026
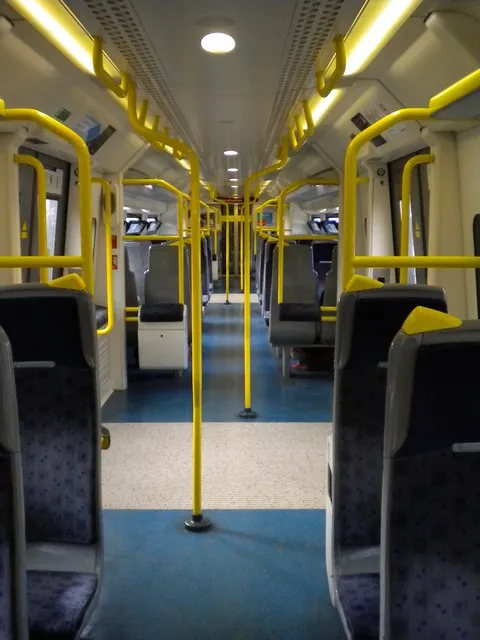
Photo: Robin Sones , CC BY-SA 2.0, via Wikimedia Commons
London's affordability debate has a habit of stopping at the rent. A flat near a Zone 5 station is cheaper than a flat near a Zone 2 station, so the map says the outer neighbourhood is more affordable. But the map is incomplete. The fare is part of the rent. So is the time spent getting to work, the reliability of the service, and the cost of the journey when the trains are disrupted and a taxi becomes the only way home.
In 2026, with rents still high and fares continuing to shape household budgets, the case for a commute-adjusted view of affordability is stronger than ever. It changes which neighbourhoods look like good value, and it changes how policymakers should think about housing supply, transport investment and community stability.
The map that rent alone misses
Station-level rent data is now granular enough to compare advertised rents around individual stops. Published fare data is also available. Put the two together and a familiar pattern emerges: headline rent savings tend to rise as you move outward, but the cost of commuting rises too. The question is whether the saving survives the fare.
Our illustrative modelling for 2026 suggests that in some outer London locations, the annual cost of a Zone 1–6 Travelcard can consume a meaningful share of the rent difference between a one-bedroom flat and a comparable home two or three zones closer in. For a single commuter on an average salary, the calculation is rarely straightforward: a £200 monthly rent saving can be eroded by a fare of more than £250 a month, before time and inconvenience are counted. For a couple sharing a flat, the fare burden doubles. For a part-time worker or someone on a variable shift pattern, a full annual Travelcard may not even be the right product.
This is why simple rent-per-month comparisons can mislead. A neighbourhood is not affordable merely because its rents are lower. It is affordable if the household can reach work, education and support networks without spending the saving on transport.
Trading space for fares
Commuters describe the trade-off in practical terms. A renter who moved from an inner London flat to a larger home near a Zone 4 station may gain a spare room and a garden, but loses an hour a day and pays a substantial annual fare. Another commuter in a Zone 6 borough may have chosen the area because the rent was manageable, only to find that the cost of getting to a Zone 1 job made the household budget tighter than expected. Some have shifted to bus-only journeys to save money, accepting longer travel times. Others have negotiated hybrid working patterns that reduce the number of paid journeys each week.
These are not abstract choices. They determine whether a neighbourhood can retain key workers, whether local high streets have customers during the day, and whether families can stay in an area as children grow. Transport costs are community development costs. A place that looks affordable on a letting agent's website may be unsustainable for the people who actually need to live there.
Why affordability metrics lag
Official affordability ratios typically compare house prices or rents with incomes. They rarely include transport. That is a significant omission in a city where the cost of getting to work varies so much by location. The result is a policy blind spot: developments can be labelled affordable because the rent is below market, even when the combined rent and travel burden is high. Outer London growth corridors may be promoted as cheaper alternatives, but if the transport offer is poor or the fare is high, the affordability gain is partly fictional.
There is also a fairness issue. Travelcard pricing is broadly zonal, but need is not. A low-paid worker commuting from Zone 5 to a central London job may spend a larger share of income on travel than a higher-paid worker making the same journey. Part-time workers, shift workers and people with caring responsibilities may not fit the standard annual season ticket model. The fare system is not designed around their lives.
A fairer yardstick
A commute-adjusted affordability measure would not be complicated in principle. It would combine rent, reasonable transport costs and travel time for a given workplace or range of workplaces. It would be less tidy than a rent map, but more honest. Local authorities, developers and transport bodies could use it when assessing site allocations, affordable housing requirements and transport investment. It would also help renters compare neighbourhoods on a like-for-like basis.
There are practical limits. People change jobs; households have more than one commuter; some work from home for part of the week. A single map cannot capture every case. But a range of commute-adjusted indicators would still be better than pretending that transport is someone else's budget line. The same logic applies to community development: if a neighbourhood is only affordable for people who do not need to travel, it is not a sustainable neighbourhood.
Counting the whole journey
London's housing crisis is often described as a supply problem, and supply matters. But affordability is also a geography problem. The places that appear cheapest are not always the places that leave households with the most money at the end of the month. As winter 2026 brings higher energy costs and renewed pressure on household budgets, the fare is too large a line item to ignore.
The next affordability map should start with the whole journey: the rent, the fare, the time and the reliability of the service. Until it does, London will keep mistaking distance from the centre for affordability, and commuters will keep paying the difference.